
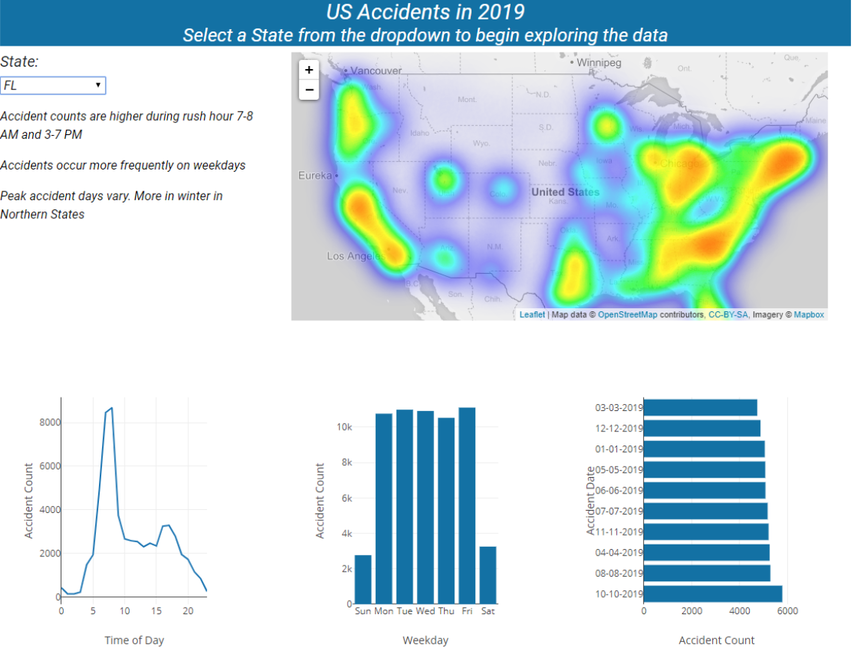
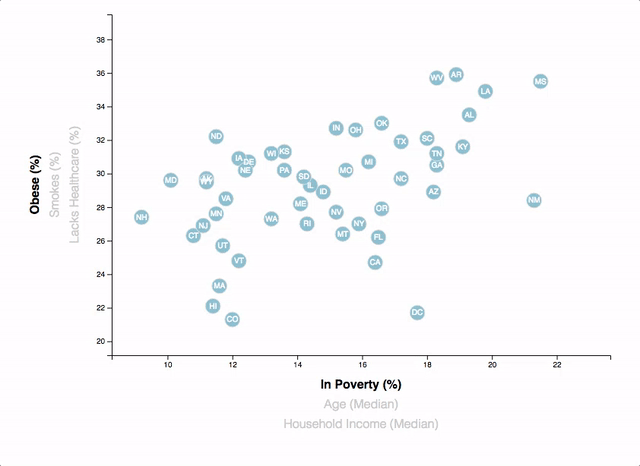
Analyze/visualize traffic accident data to uncover correlations between associated metrics. Technologies: Python, SQLite, JQuery, Bootstrap, D3, Plotly, Leaflet, HTML5, CSS
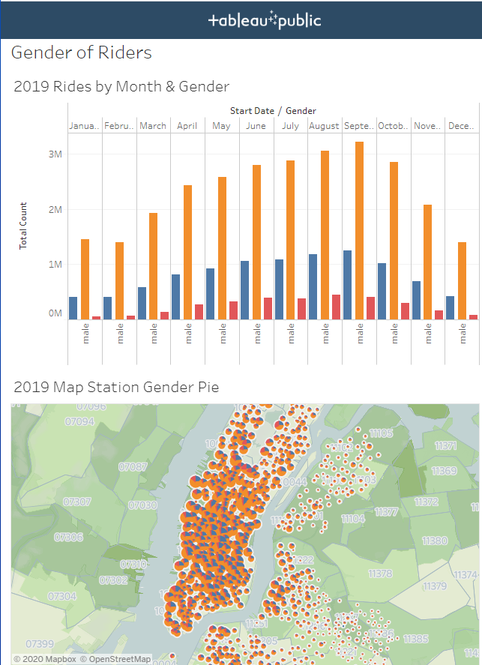
Analyze NYC CitiBike trends over 2014 - 2019. Technologies: Python, numpy, pandas, excel, Tableau.
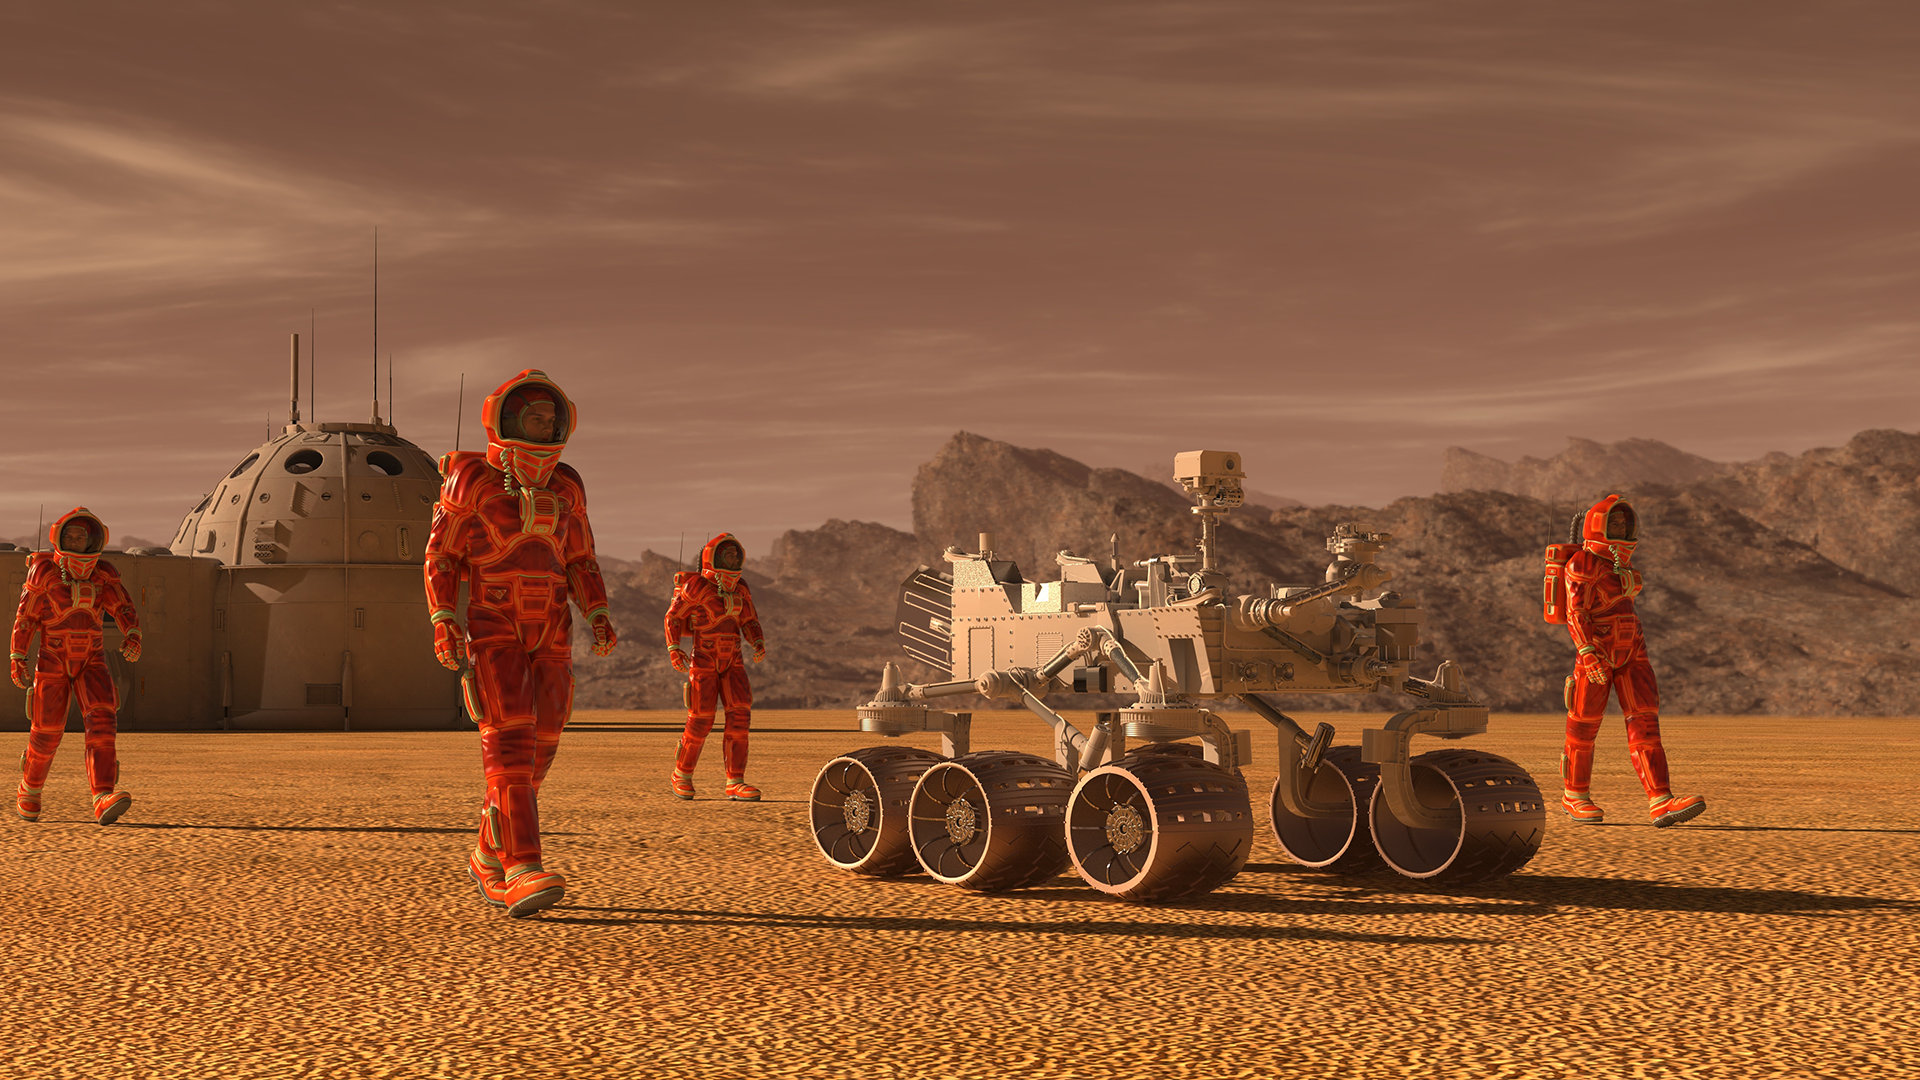
A web application that scrapes various websites for data related to the Mission to Mars and displays the information in an HTML page. Technologies: Python, Beautiful Soup, Pandas, Splinter, Flask, HTML5, JavaScript, CSS, MongoDB
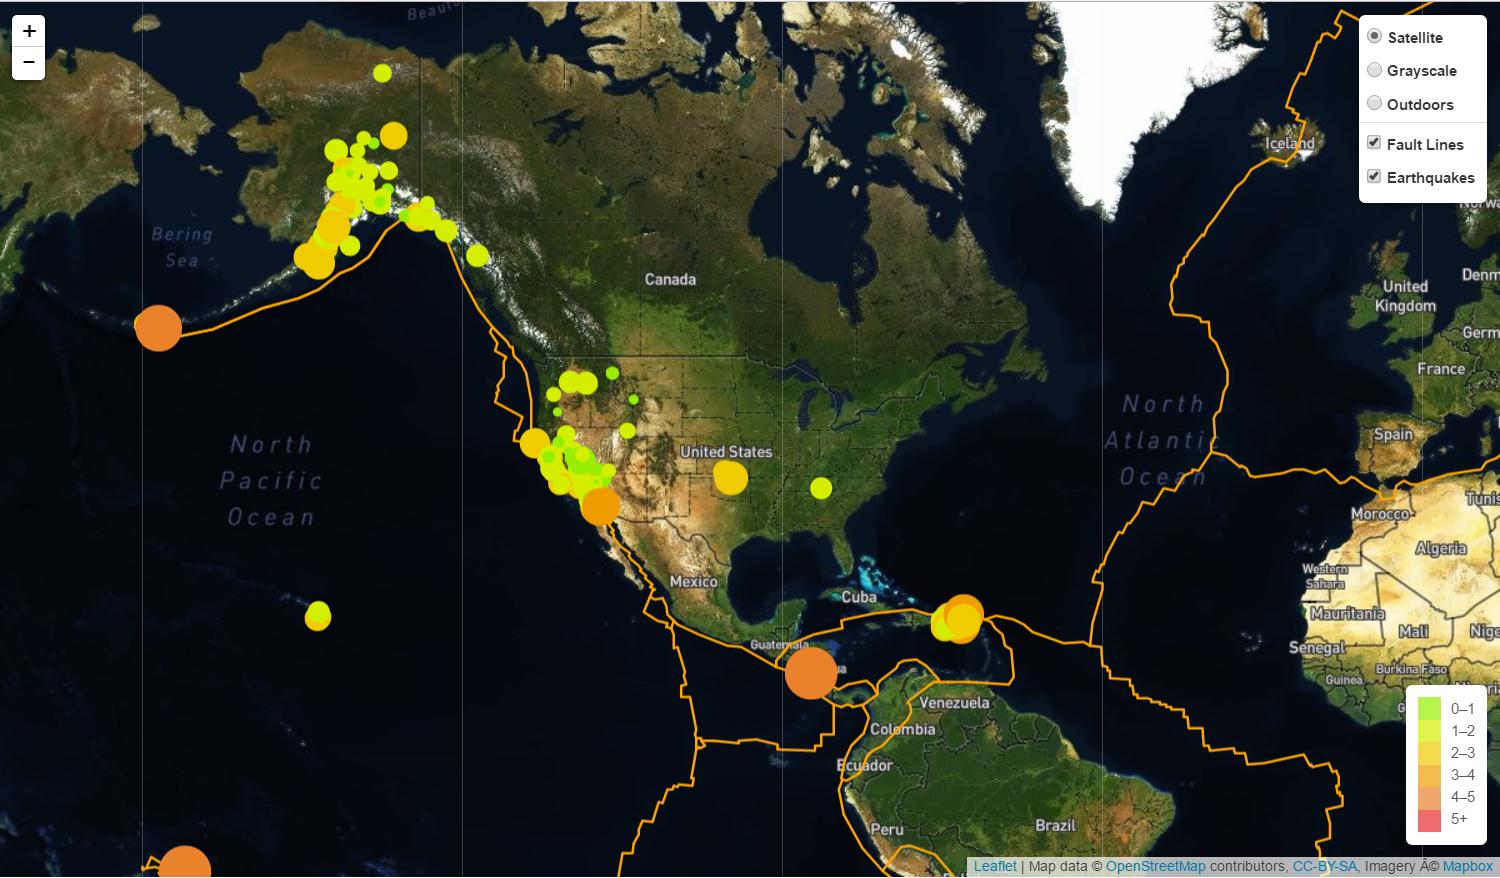
Visualize USGS earthquake data in a meaningful way. Being able to visualize the data will allow for the better education of the public and other government organizations on issues facing our planet. Technologies: Leaflet, GeoJSON, HTML5, JavaScript, CSS
Analyzed the current trends shaping people's lives, as well as created charts, graphs, and interactive elements to help readers understand the findings. Technologies: Data Driven Document (D3), HTML5, Javascript, CSS
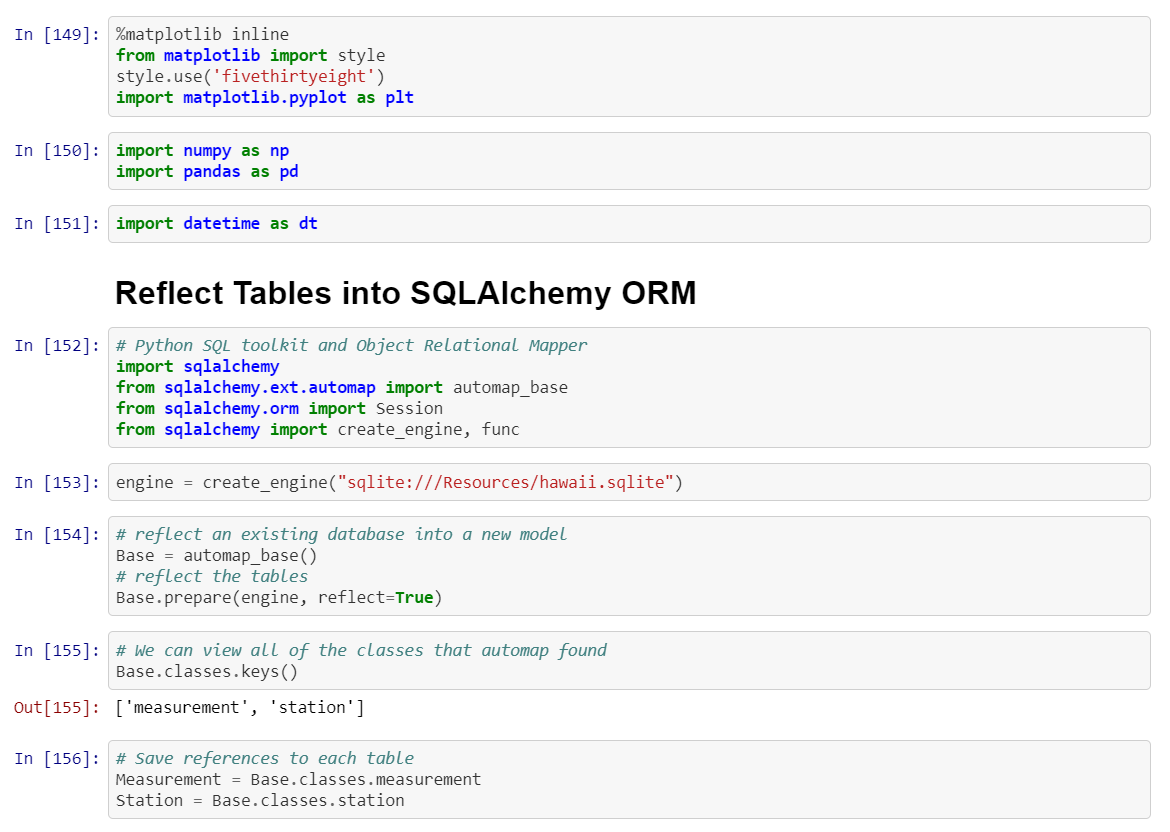
Climate analysis and data exploration. Technologies: SQLAlchemy ORM queries, SQL, Python, Pandas, Flask, Numpy and Matplotlib